It’s hard to know where to look when attempting to assess the state of China’s domestic tourism industry. Should one dig into trends like the sudden craze for “deep travel,” pampered staycations, and self-driving getaways? Or are the destinations to which domestic tourists began flocking once lockdowns lifted and confidence grew in mid-2020 better indicators? What can be learned from the surging popularity of Hainan or the untold masses taking up winter sports?
Fastdata, a Chinese company specializing in data analytics across a range of sectors from education to media, has focused on China’s online travel agencies (OTAs) for its 2020 report. Pre-pandemic, Chinese OTAs already dominated the sector on account of platforming extremely competitive offerings for a digital-savvy market. That supremacy has grown during a year of online everything. Understanding the dynamics of China’s OTA landscape has never been more pressing.
Here are five key graphs that shed light on the state of China’s online travel industry.
China’s Travel Recovery (January 2020 to December 2020)
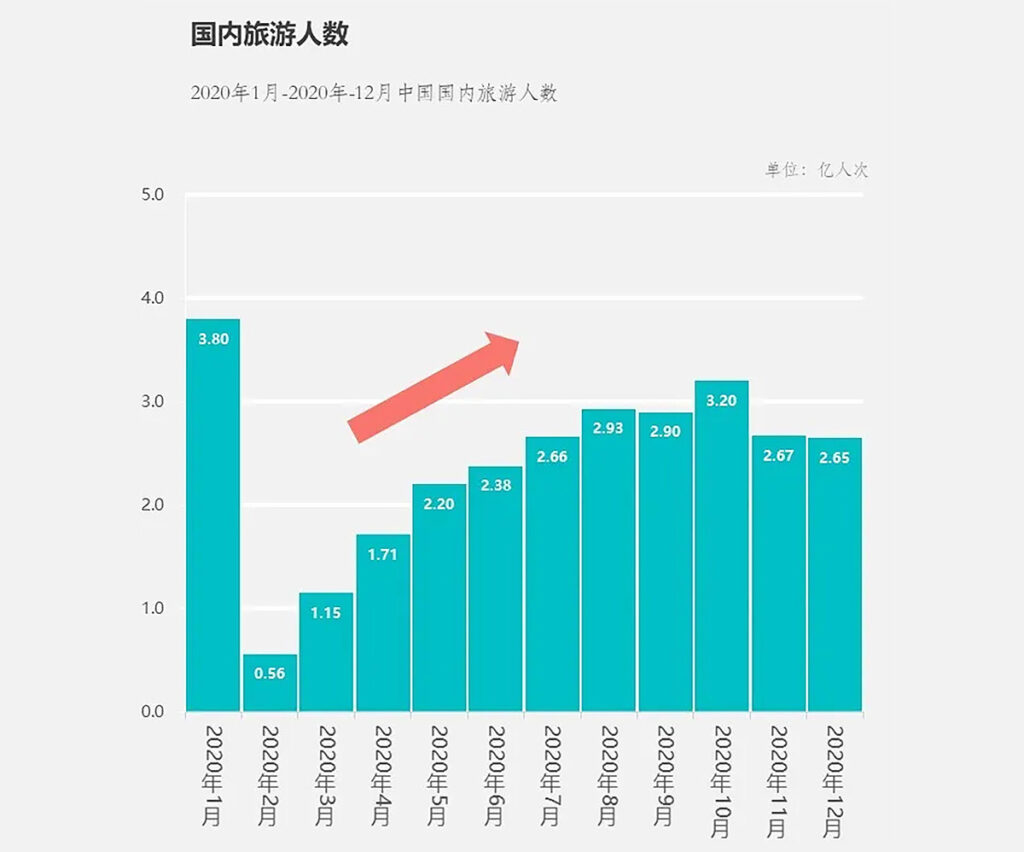
What the graph shows: The steady recovery of China’s domestic industry from a meagre 56 million travelers at the onset of the pandemic in February last year rose to 265 million by the end of the year. In total, 2020 saw a 52 percent decrease in tourist numbers compared to 2019.
Fastdata also found: Airplane travel and train travel recovered 75 percent and 79 percent respectively on 2019’s figures.
Why it matters: Despite the optimism surrounding China’s domestic market, the graph shows the considerable room for growth; and with international destinations off the cards until at least mid-2021, expect record breaking numbers across this year’s holidays. Furthermore, the relatively faster recovery rate of rail travel evidences the growth of local travel.
OTA Users by City Tiers
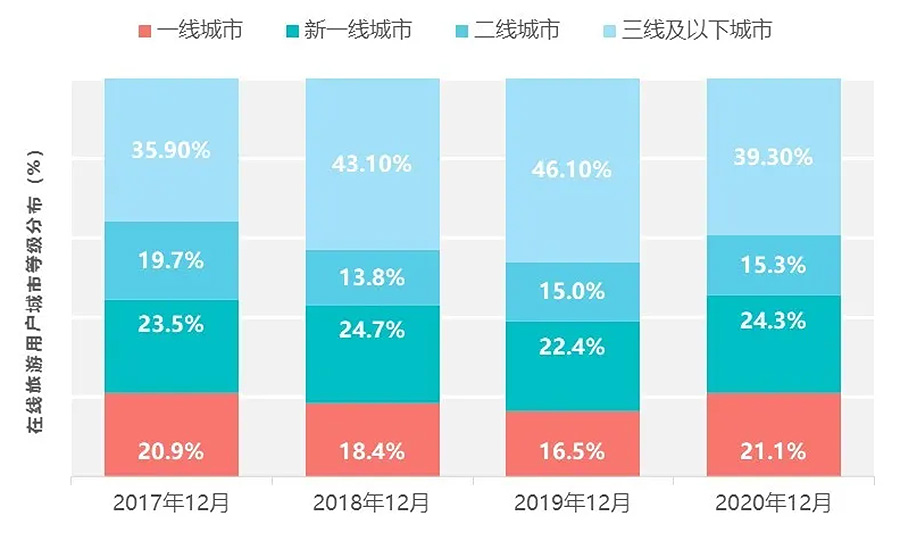
What the graph shows: Tier One users (in red) and New Tier One Cities (green) residents were more active users of OTAs in 2020. The group’s overall market share grew by 6.5 percent from 38.9 percent in 2019.
Fastdata also found: OTAs’ users are 23 percent Gen Z, 38 percent Gen Y, 29 percent Gen X (10 percent other). Gen Z is the fastest growing group.
Why it matters: The economic impact of the pandemic hasn’t been spread evenly. Residents in more affluent Tier One cities are both more willing and financially able to begin traveling again.
OTA Gross Merchandise Volume (2015 to 2020)
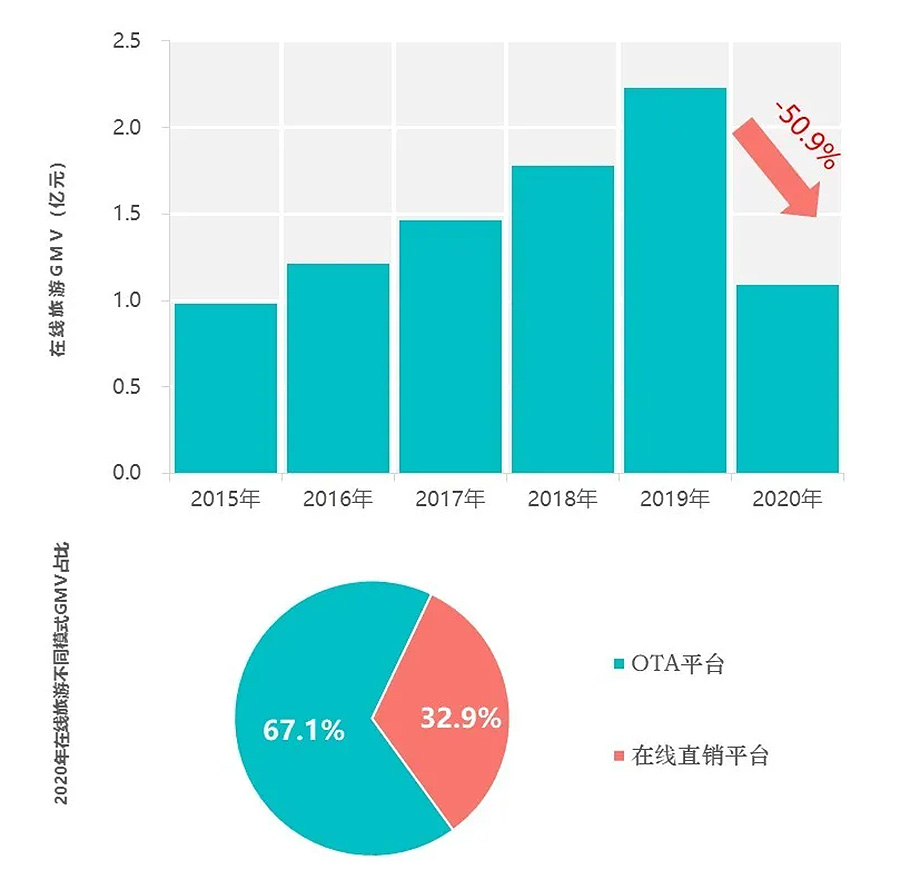
What the graphs show: At the top, OTA gross merchandise volume (GMV) dropped 50.9 percent in 2020 year-on-year; and at bottom, direct sales constituted 32.9 percent of total GMV.
Why it matters: The pandemic further consolidated the dominance of major OTAs.
Distribution of GMV by OTA in 2020
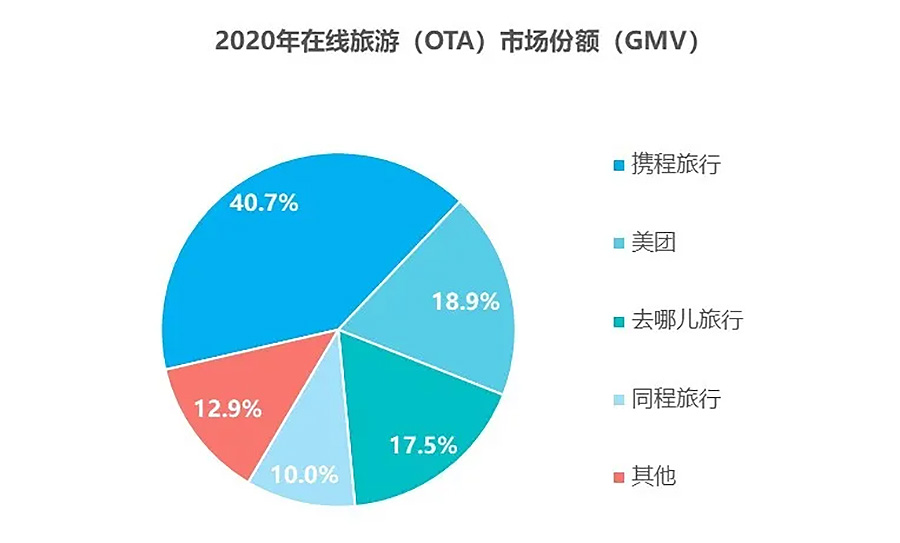
What the chart shows: GMV breaks down as follows: Ctrip (in dark blue) 40.7 percent, Meituan (blue) 18.9 percent, Qunar (green) 17.5 percent, Tongcheng (pale blue) 10 percent, and other (red) 10 percent.
Fastdata also found: In an international context, Booking.com leads in Europe with revenue of $5.3 billion, Expedia in the U.S. with $2.8 billion, and Ctrip in China with $2 billion. Ctrip’s 49 percent recovery was more substantial than its European and U.S. counterparts (47 percent and 46 percent respectively).
OTA Users by Education Background in December 2020
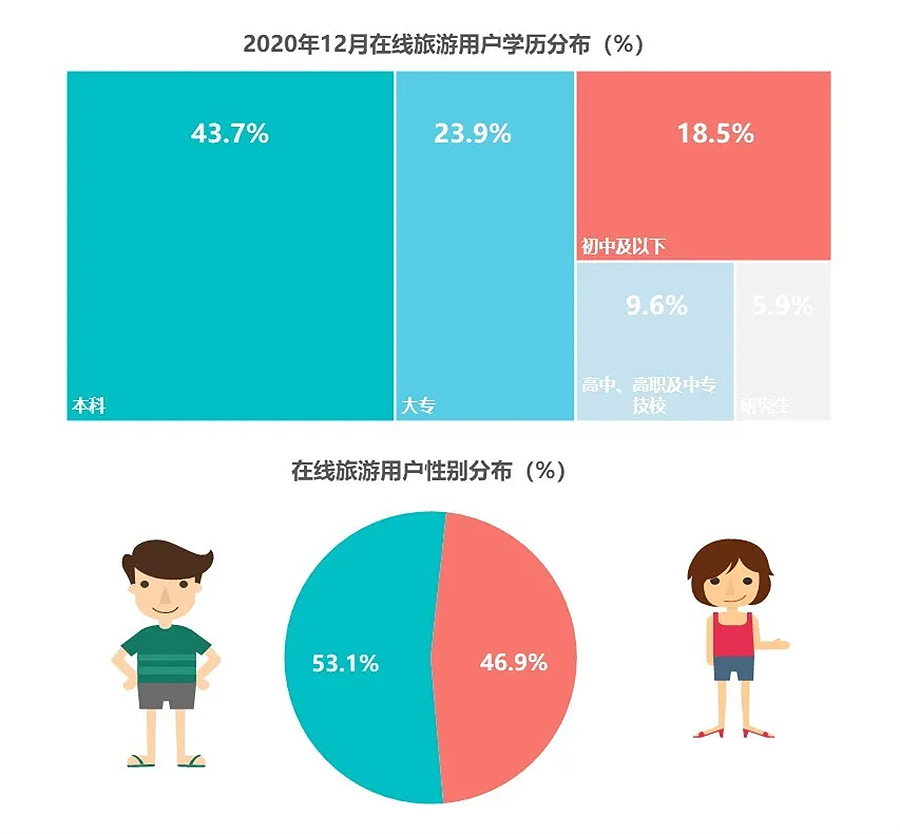
What the chart (top) shows: OTA users break down by educational background as follows: 43.7 percent hold undergraduate degrees (green), 23.9 percent (blue) graduated from vocational college, 18.5 percent received at most a middle school diploma, 9.6 percent (pale blue) graduated from vocational high school and high school, 5.9 percent (grey) hold master degrees.
What the chart (below) shows: 53.1 percent of OTA users are female.
Why it matters: With higher education attainment typically indicating greater affluence, this is further evidence that China’s white collar workforce is far more ready to continue traveling in 2021 than other group that had increased market share prior to the pandemic.


